Human capital

Recognising that our people are a fundamental part of CLHG achieving its purpose and strategic goals, we continue to build on our culture by investing in them. Ongoing business transformation remains a strategic objective and, despite the group’s centralised management structure, each hotel management team is granted notable independence to appoint and manage their own people and undertakes to instil the values of the group in its staff. At the same time, management is identifying areas where new skills can be learned, and existing skills can be improved upon.
Accordingly, our objective is to employ a diverse, properly supported, comprehensively trained, suitably compensated, and satisfied workforce.
EMPLOYEE VALUE PROPOSITION
The group recognises that the reputation and marketability of the CLHG and its individual hotel brands are held in our employee’s hands. Our top priority is attracting and impressing guests in our hotels. Likewise, we take every opportunity to attract and impress top quality staff. Strategically, this means that the group must focus on bringing the right type of potential in, and identifying, growing, and encouraging leadership that is dedicated to making a difference at every level.
We take every opportunity to grow both internal and external talent through targeted development programmes and meaningful succession planning. We attract skilled and hardworking employees by offering a safe and stimulating work environment, a unique identity and diverse culture, interpersonal significance, and innovative work practices. CLHG has expanded over the years, and we are always on the lookout for fresh and diverse talent to add to our growing family. We pride ourselves on above-average employee engagement resulting in below-average attrition, and our workforce says that job security, employment benefits and job satisfaction are what CLHG offers most. Through our internal recognition and reward programme, we encourage staff and guests to recognise when our teams are doing things right.
We are proud that 95% of our current leaders were developed internally. Attracting and retaining top talent is crucial to developing a sustainable pipeline of leaders for the future and our employee turnover rate of 11.42% is significantly lower than the industry average.
| Year | Voluntary turnover |
Involuntary turnover |
% of total headcount |
| 2021/22 | 99 | 30 | 11.42 |
| 2020/21 | 28 | 11 | 3.45 |
| 2019/20 | 41 | 22 | 5.52 |
| 2018/19 | 69 | 33 | 8.48 |
| 2017/18 | 74 | 19 | 7.88 |
EMPLOYEE AND INDUSTRIAL RELATIONS
The South African Commercial, Catering and Allied Workers Union (SACCAWU) currently represents 12.71% of the group’s employees. CLHG maintains a recognition agreement with SACCAWU. No workdays were lost because of industrial action during FY22.
Group managers and union shop stewards attend refresher courses on group policies and procedures to facilitate communication and collaboration.
Maintaining good industrial relations remains imperative for CLHG, given the challenging economic and socio-political environment in which we operate.
HEALTH AND SAFETY
In the interests of the health and wellbeing of our guests and staff, the group takes all necessary measures to ensure their safety. Every hotel has a health and safety committee, with appointed people being responsible in terms of the Occupational Health and Safety Act. Each of our hotels has at least one staff member who has been trained to give first aid in the event of an emergency.
The standard of the health and safety practices of our 59 hotels is reviewed annually as part of the internal audit process and our service providers are required to adhere to the group’s health and safety requirements, despite the South African Covid-19 regulations having been repealed. All our hotels are required to maintain hygiene standards that meet or exceed Hazard Analysis of Critical Control Points (HACCP) legislation.
In respect of safety, the group encourages its staff to vaccinate against Covid-19 and will assist any member of staff, especially those staff members living with comorbidities, to gain this additional immunity, and to date at least 90% of our staff have received the vaccine.
Safety performance
During the year, 34 staff health and safety issues were reported and resolved (FY21:7). The group invested R0.2 million in employee occupational health and safety across all hotels.
Wellness programmes
Employees have access to an independent wellness programme offering:
- free counselling for trauma and mental health
- debt counselling and protection issues
- retirement planning.
LAUNCH OF OUR GENDER-BASED VIOLENCE EMPLOYEE-ASSISTANCE PROGRAMMES
The group is aware and disturbed by the alarming prevalence of gender-based violence in our communities. In response, on 1 July 2022 we launched the Whispa GBV programme that gives staff and their immediate family members access to a confidential support programme available to any person who is a victim of, or who is exposed to, gender-based violence. We recognise the complexity of the different circumstances in which a person can experience gender-based violence and the limitations or obligations that can perpetuate a bad situation.
The programme is anonymous and provides immediate support for guests, employees and their loved ones, facing such a situation. We aim to guide those affected towards a safer, healthier, and more empowered life.
Closer to home, we are committed to creating an inclusive workplace where every employee feels that they belong, can thrive, live up to their potential and are physically and psychologically safe. We strive to create this environment through our systems, processes, policies and our organisational culture. This includes driving a culture where we educate and empower our colleagues about all forms of abuse, including gender-based violence, bullying, victimisation, and sexual harassment as part of our prevention approach, as well as policies and mechanisms to deal firmly with any forms of abuse.
While rooms and facilities play a big part in creating positive guest experiences, the main drivers of these experiences are our staff. Based on this understanding, we created and implemented our WOW service excellence programme to encourage the utmost thought, respect and care for our guests.
The programme is designed to allow peers, managers and colleagues to recognise and reward outstanding performance, in those finer day-to-day activities, which ultimately contribute to our guests WOW experience.
The programme invites innovative thinking and creative ideas from our employees in how to delight our guests, while also making their jobs easier through efficiencies. Participating employees are rewarded for delivering WOW initiatives or experiences on the group’s social media pages or over the CLHG app.
This programme brings about an enhanced focus on putting our guests first.
ATTRACTING, RETAINING, AND MOTIVATING PEOPLE
The group talent manager is primarily responsible for attracting, developing and retaining high-calibre people. Following annual appraisals for all CLHG employees, those who show leadership or specialist potential are placed on specific career development paths. We prioritise previously disadvantaged individuals in accordance with our employment equity and transformation goals.
TRAINING AND DEVELOPMENT – UPSKILLING AND EMPOWERING OUR PEOPLE
During the year under review, the group has honoured its commitment to empowering, upskilling, and developing our employees to maximise their potential and ensure they can take advantage of every opportunity to further their careers. In this regard, the group has an average development spend per employee of R4 140 and our employees benefitted from various training programmes during the year.
Much of the training and development that has taken place during the year has been for of our kitchen and dining staff, who have benefitted from the coaching by our Senior operations manager – food & beverage. This year, many of the individuals hired as part of the YES programme were placed in our food and beverage divisions for the same reason.
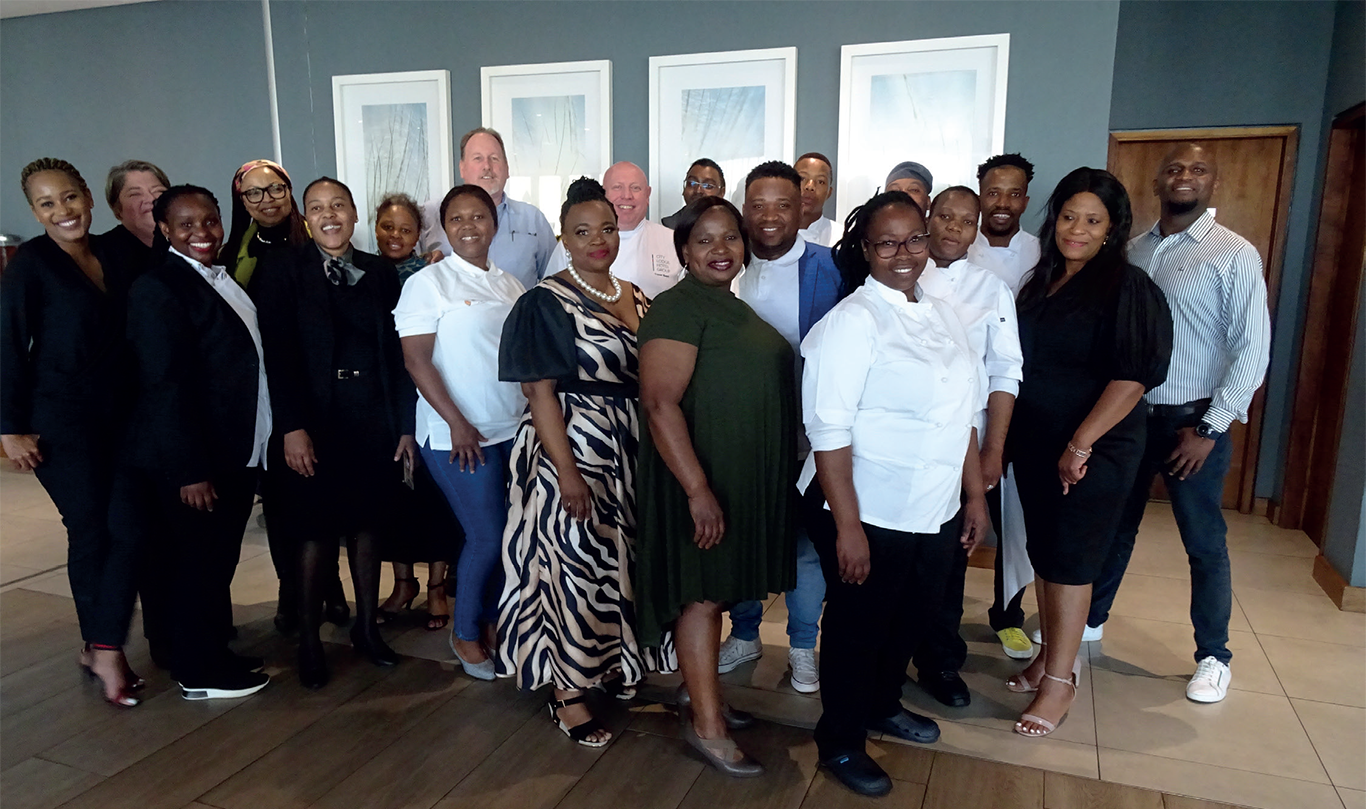
Nine kitchen staff successfully completed the SA Chefs Association Recognition for prior Learning Programme.
TRAINING SPEND OVER A FIVE-YEAR PERIOD
| 2021 | 2020 | 2019 | 2018 | 2017 | |
| % of total payroll spent on training | 1.86 | 1.93 | 3.53 | 4.00 | 3.75 |
| % of total payroll spent on training previously disadvantaged employees | 1.57 | 1.75 | 2.13 | 3.66 | 3.40 |
| Total number of training interventions attended by all employees | 7 146 | 13 564 | 14 870 | 15 244 | 15 631 |
| Total number of training interventions attended by black employees | 6 244 | 12 295 | 13 498 | 13 819 | 14 209 |
| Total number of training interventions attended by black female employees | 3 974 | 8 731 | 8 859 | 9 055 | 9 494 |
| Total spend on training and development | R4.6 million | R4.4 million | R10.1 million | R11.2 million | R10.5 million |
* Training is measured on a calendar year. The table above is based on training received within the respective calendar year.
We are passionate about developing people and offer numerous opportunities such as:
- On-the-job training
- E-learning
- Internal development programmes
- Learnerships
- Work integrated learning
- Succession planning
- Accelerated Development
- Deployment Programmes (ADDP)
- Graduate Intern Programme (GIP)
The below diagram illustrates the three primary areas on which our training and development focused during the year under review.
- Health and safety
- Hygiene
- First-aid
- Firefighting
- Protection of personal information
- Accreditation for role purposes
- IT and online security
- Coaching skills for all senior managers
- Hospitality management skills
- Online check-in procedure
- Food and beverage online training through the Unilever Academy App
- Food costing
- CLHG property management systems
- In-house procedures
Training and development highlights
Every year, the group looks forward to welcoming hotel school students from across South Africa to gain practical experience at the group’s hotels, as part of our work-integrated learning programme. Following the emergence of Covid-19, which resulted in the temporary suspension of services in several of the group’s hotels and disruption to the academic year, this programme was suspended in 2020 but reinstated in the current financial year.
During the year under review, the group celebrated several other highlights:
- City & Guilds qualifications: CLHG permanent employees may attend these programmes to earn an internationally recognised qualification. A total of 33 employees completed their City & Guilds programmes during the second half of the financial year.
- Learnership opportunities to unemployed individuals: The group is currently hosting seven previously unemployed learners in a Food & Beverage programme.
- Executive Development Programme for Women in Leadership: Three junior management employees are participating in this programme. It is funded by the Department of Tourism in partnership with the University of South Africa (UNISA).
- The group participates in various government funded programmes providing learners with the opportunity to gain experience and exposure in the workplace.
- The group participated in a 12-month work integrated learning programme in Mpumalanga, empowering unemployed youth with essential workplace experience, skills and exposure.
- The group hosted 64 hospitality students from various institutions for their work integrated learning programmes.
SUCCESSION PLANNING
As a part of our strategy to transform, develop, and grow our own succession structure, a number of black candidates are selected annually to participate in the group’s accelerated development and deployment programme. The group already boasts a number of current general managers who graduated from this programme.
SKILLS DEVELOPMENT COMMITTEE
The skills development committee is mandated to analyse the group holistically in order to see where additional skills and training are needed in the organisation, as well as to deal with skills development issues and to assist in determining the group’s skills development strategy. The group’s registered skills development facilitator, assisted by a training coordinator, submits a mandatory grant plan annually and reports on training achieved against that plan.
The committee meets at least twice annually and includes:
| (i) | the divisional director: human resources |
| (ii) | the group’s registered skills development facilitator |
| (iii) | a union representative and regional shop stewards |
| (iv) | staff members from different levels and backgrounds, elected by their constituencies. |
TRANSFORMATION
The group believes that transformation in the workplace is a business imperative. The need for change in society becomes clearer with every year that passes, and we recognise the impact that a large organisation can have in this regard. We endeavour to match our staff demographics with those of our guests and the country as a whole. The group aims to transform itself organically, by bringing in young people with limited access to meaningful opportunity and providing them with the means to reach their potential.

In line with this understanding, we continue to make real progress in our transformation efforts. The group has honoured its commitment to avoid any disparity in salaries based on race, gender or age since its inception. We are absolutely committed to equal opportunities and advancing opportunities for women in our business and the hotel industry as a whole. As a result, more than 59.1% of our general managers today are women and we continue focusing on increasing this percentage.
The impact of the Covid-19 pandemic over the last two years forced us to prioritise operational sustainability and financial survival over our B-BBEE priorities, which unfortunately resulted in a drop to our last B-BBEE scorecard to a Level 5 contributor, which is below our minimum target of a Level 4 contributor but we have resumed efforts and activities to achieve the target level 4 score. Our current certificate expires on 21 November 2022, and we are currently in the verification process to secure a new scorecard.
As we slowly recover from the pandemic over the last 12 months under review, the group has refocused our strategic B-BBEE initiatives which include:
- We have renewed our investment in the development of our staff by encouraging skills development through new and existing e-learning courses and in on-site on-the-job practical training and assessment.
- We have maintained our corporate social investment partnerships, e.g., Emthonjeni Community Centre in Zandspruit, which has become a centre for goods that may not have otherwise been available to the people in that community.
- We remain committed to supporting Small and Medium Enterprises and our economic development partners, who have been hardest hit by the pandemic, due to their reliance on the hospitality and travel industry.
- Going forward, the group intends monitoring its supplier spend as it relates to local and B-BBEEcompliant suppliers as part of its overarching sustainability strategy.
| Scorecard element | Weighting | Score 2021/2022 |
Score 2020/19 |
| Ownership | 27.00 | 18.09 | 17.68 |
|---|---|---|---|
| Management control | 19.00 | 14.00 | 13.49 |
| Skills development | 20.00 | 12.08 | 17.69 |
| Enterprise and supplier development | 40.00 | 29.53 | 34.35 |
| Socio-economic development | 5.00 | 6.35 | 7.24 |
| Total B-BBEE score | 111.00 | 80.05 | 90.45 |
Transformation in Tourism
Our chief operating officer, Lindiwe Sangweni-Siddo, alongside our food and beverage manager, Trevor Boyd, served as an ambassador for CLHG at the Hostex exhibition, held at the Sandton Convention Centre in June 2022.
For the occasion, Lindiwe authored an opinion piece titled “Change in transformation and gender equality in tourism will deliver economic growth”, in which she explores the varied opportunities available to organisations in the hospitality sector to transform the industry in the ways that matter most.
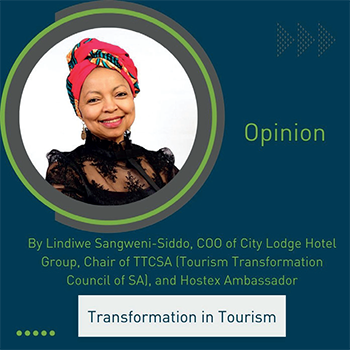
Chief among Lindiwe’s concerns is the implementation of the Tourism Transformation Charter, developed by the Tourism Transformation Council of SA (TTCSA), of which Lindiwe was chair from June 2019 to May 2022. The Charter acknowledges that our industry is characterised by large disparities in accessing opportunities and benefits, and Lindiwe encourages the incorporation of new products into the market that are culturally attractive, diverse, and owned and managed by black people in order to grow the tourism footprint in South Africa.
With Lindiwe’s insight into the market and access to market data in respect of the tourism industry’s collective move toward transformation and gender equity, she is one of the main drivers behind CLHG’s transformation strategies. Her experience in transformation initiatives and processes allows the group to bypass strategies that serve only to create an illusion of transformation in an organisation, and to establish a transformation plan that is efficient and that holds substance.
To access Lindiwe’s opinion piece, visit https://www.hostex.co.za/change-in-transformation-and-gender-equality-in-tourism-willdeliver- economic-growth/.
Our sustainability metrics in respect of human capital are outlined below:
| Disclosure Topic | Key Performance Indicator | 2022 | 2021 |
| Employee Composition | Total employees at year-end (number) | 1 213 | 1 148 |
|---|---|---|---|
| Gender profile (% of permanent employee headcount) | |||
| – Male employees | 38.4 | 38.2 | |
| – Female employees | 61.6 | 61.9 | |
| Racial profile (% of permanent employee headcount) | |||
| – African employees | 71.9 | 71.2 | |
| – Coloured employees | 11.0 | 11.1 | |
| – Indian employees | 2.1 | 2.1 | |
| – White employees | 15.0 | 15.6 | |
| Cultural profile (% of permanent employee headcount) | |||
| – Employees from SA | 99.5 | 99.5 | |
| – Other foreign national employees | 0.5 | 0.5 | |
| Headcount by remuneration type (% of permanent employee headcount) | |||
| – Defined decision-making | 29.7 | 31.0 | |
| – Discretionary decision-making | 36.1 | 34.2 | |
| – Junior management | 20.4 | 20.4 | |
| – Middle management | 6.8 | 7.4 | |
| – Senior management | 6.1 | 6.2 | |
| – Top management | 0.9 | 0.9 | |
| Total number of new hires by grade (number) | |||
| – General staff | 118 | 40 | |
| – Junior management | 11 | 1 | |
| – Middle management | 4 | – | |
| Percentage of employees with disabilities | 1.1 | 1.1 | |
| Management Composition | Total employees in management positions (number) | 387 | 388 |
| Management Composition (% of total employees in management positions) | |||
| – Black junior managers | 87.9 | 86.3 | |
| – White junior managers | 12.1 | 12.3 | |
| – Black middle managers | 63.6 | 67.1 | |
| – White middle managers | 36.4 | 31.7 | |
| – Black senior and top managers | 24.0 | 24.0 | |
| – White senior and top managers | 76.0 | 76.0 | |
| – Female managers | 59.2 | 58.2 | |
| – Male managers | 40.8 | 41.8 | |
| Freedom of association and collective bargaining | Percentage of active workforce covered under collective bargaining agreements | 12.79 | 13.50 |
| Employee Engagement | Number of reports of discrimination and harassment incidents, investigation status of reported incidents, and actions taken and the total amount of monetary losses as a result of legal proceedings associated with: i. law violations; and ii. employment discrimination |
||
| i. Nil ii. Nil |
i. One harassment
incident ii. Nil |
||
| Total number and rate of new employee hires during the reporting period, by age group, gender, other indicators of diversity | 133 | 11.8% | 41 | 3.6% | |
| Age group (number) | |||
| – Under 35 years | 108 | 34 | |
| – Between 35 – 55 years | 25 | 7 | |
| – Over 55 years | – | – | |
| Race (number) | |||
| – African | 105 | 36 | |
| – Coloured | 17 | 1 | |
| – Indian | 4 | 2 | |
| – White | 7 | 2 | |
| Gender (number) | |||
| – Female | 61 | 18 | |
| – Male | 72 | 21 | |
| Involuntary turnover rate (%) | 2.7 | 1.0 | |
| Voluntary turnover rate (%) | 8.8 | 2.5 | |
| Average turnover rate overall (%) | 11.4 | 3.5 | |
| Voluntary turnover rate by grade (%) | |||
| – General staff | 5.7 | 2.0 | |
| – Junior management | 2.0 | 0.2 | |
| – Middle management | 0.9 | 0.3 | |
| – Senior management | 0.2 | – | |
| – Top management | – | – | |
| CLHG average tenure | 9.4 years | * | |
| SA National average tenure | 2.8 years | * | |
| Occupational Health and Safety | Work-related accidents reported (number) | 34 | 7 minor issues reported |
| – Number of Fatalities | 0 | – | |
| – Number of First Aid Cases (FACs) | 29 | * | |
| – Number of Lost Time Injuries (LTIs) | 5 | * | |
| Lost Time Injury Frequency Rate (LTIFR) (%) | 1.8 | * | |
| Total spend on health and safety of employees (ZAR) | R151 000 | * | |
| Employee Training and Development | Total number of training programmes attended by employees | 7 146 | 13 564 |
| Training programmes attended by male employee (number) | 2 703 | 4 833 | |
| – African males (%) | 72.6% | 73.4% | |
| – Coloured males (%) | 9.7% | 13.8% | |
| – Indian males (%) | 3.6% | 2.6% | |
| – White males (%) | 16.0% | 10.2% | |
| Training programmes attended by female employees (number) | 4 443 | 8 731 | |
| – African females (%) | 75.9% | 75.5% | |
| – Coloured females (%) | 10.4% | 14.2% | |
| – Indian females (%) | 2.0% | 1.3% | |
| – White females (%) | 10.6% | 9.0% | |
| Total spend on training and development (% of payroll) | 1.6% | 1.9% | |
| Percentage of total payroll spent on training previously disadvantaged employees | 1.4% | 1.7% | |
| Average training and development spend per employee (ZAR) | R4 141 | R4 009 | |
| Employee Remuneration and Pay Equality | Total spend on employee remuneration and benefits (excluding taxes) (ZAR) | R279.7m | R227.5m |
| Ratio of the annual total compensation for the highest-paid individual of significant operations to the median annual total compensation for all employees (excluding the highest-paid individual) | 30:1 | * | |
| Ratio of standard entry-level wage by race and gender compared to local minimum wage for the sector | 2.5:1 | * |
* Not previously reported

EMPLOYEE PROFILE 2022
| Occupational Levels | Male | Female | |||||||||
| Black | Coloured | Indian | White | Black | Coloured | Indian | White | FN: Male |
FN: Female |
TOTAL | |
| Top management | – | – | 1 | 4 | 2 | 1 | 1 | 1 | – | – | 10 |
|---|---|---|---|---|---|---|---|---|---|---|---|
| Senior management | 6 | 4 | – | 34 | 3 | 1 | – | 21 | – | – | 69 |
| Mid-management | 10 | 2 | 3 | 13 | 25 | 8 | 1 | 15 | – | – | 77 |
| Junior management | 51 | 9 | 3 | 15 | 115 | 23 | 2 | 10 | – | 3 | 231 |
| Discretionary decision making | 118 | 15 | 3 | 12 | 183 | 26 | 10 | 40 | – | 1 | 408 |
| Defined decision making | 116 | 10 | – | 5 | 177 | 25 | – | – | 2 | – | 335 |
| TOTAL PERMANENT | 301 | 40 | 10 | 83 | 505 | 84 | 14 | 87 | 2 | 4 | 1 130 |
| Temporary employees | 20 | 2 | 1 | – | 57 | 3 | – | – | – | – | 83 |
| GRAND TOTAL | 321 | 42 | 11 | 83 | 562 | 87 | 14 | 87 | 2 | 4 | 1 213 |
EMPLOYEE PROFILE 2021
| Occupational Levels | Male | Female | |||||||||
| Black | Coloured | Indian | White | Black | Coloured | Indian | White | FN: Male |
FN: Female |
TOTAL | |
| Top management | – | – | 1 | 4 | 2 | 1 | 1 | 1 | – | – | 10 |
| Senior management | 5 | 5 | – | 34 | 3 | 1 | – | 21 | – | – | 69 |
| Mid-management | 12 | 2 | 4 | 12 | 28 | 8 | 1 | 14 | – | 1 | 82 |
| Junior management | 50 | 10 | 3 | 16 | 109 | 21 | 3 | 12 | – | 3 | 227 |
| Discretionary decision making | 101 | 14 | 3 | 12 | 176 | 26 | 7 | 42 | – | – | 381 |
| Defined decision making | 120 | 11 | – | 6 | 181 | 25 | – | – | 2 | – | 345 |
| TOTAL PERMANENT | 288 | 42 | 11 | 84 | 499 | 82 | 12 | 90 | 2 | 4 | 1 114 |
| Temporary employees | 9 | 2 | 1 | 1 | 17 | 2 | – | – | 1 | 1 | 34 |
| GRAND TOTAL | 297 | 44 | 12 | 85 | 516 | 84 | 12 | 90 | 3 | 5 | 1 148 |